

ON THIS PAGE
Introduction
Everyone quotes a “$X billion TAM.” Very few can defend the number—or use it to run sales. If you’re leading GTM, RevOps, or product marketing, your board wants credible market sizing and your revenue team needs a sizing model that actually informs territories, quotas, and pipeline. This guide explains what TAM is (in revenue or customer terms), how it differs from SAM and SOM, and how to calculate it using top‑down, bottom‑up, and value theory approaches. You’ll also see how TAM should flow straight into sales capacity planning, territory design, and the plays your SDRs and AEs run each quarter. Finally, we include a worked SaaS example with copy‑ready math and a worksheet you can adapt.
TAM, Defined (in plain English)
The core definition
Total Addressable Market (TAM) is the total demand for a product or service—often expressed as annual revenue opportunity if you captured 100% of a clearly defined market. Many teams also model TAM in units or customers/seats and then multiply by price to convert to revenue. Both framings are useful:
Revenue TAM: “How much ARR exists if every qualified buyer purchased at our price?”
Customer/seat TAM: “How many buyers/seats exist in our market?”
Quick SaaS example: A compliance tool priced at €20/seat/month with 1.2M eligible seats implies €288M/yr revenue TAM (1.2M × €20 × 12).
Why this matters: execs and investors use TAM to gauge opportunity size and justify resourcing. Revenue leaders use it to set realistic targets and coverage.
TAM vs SAM vs SOM
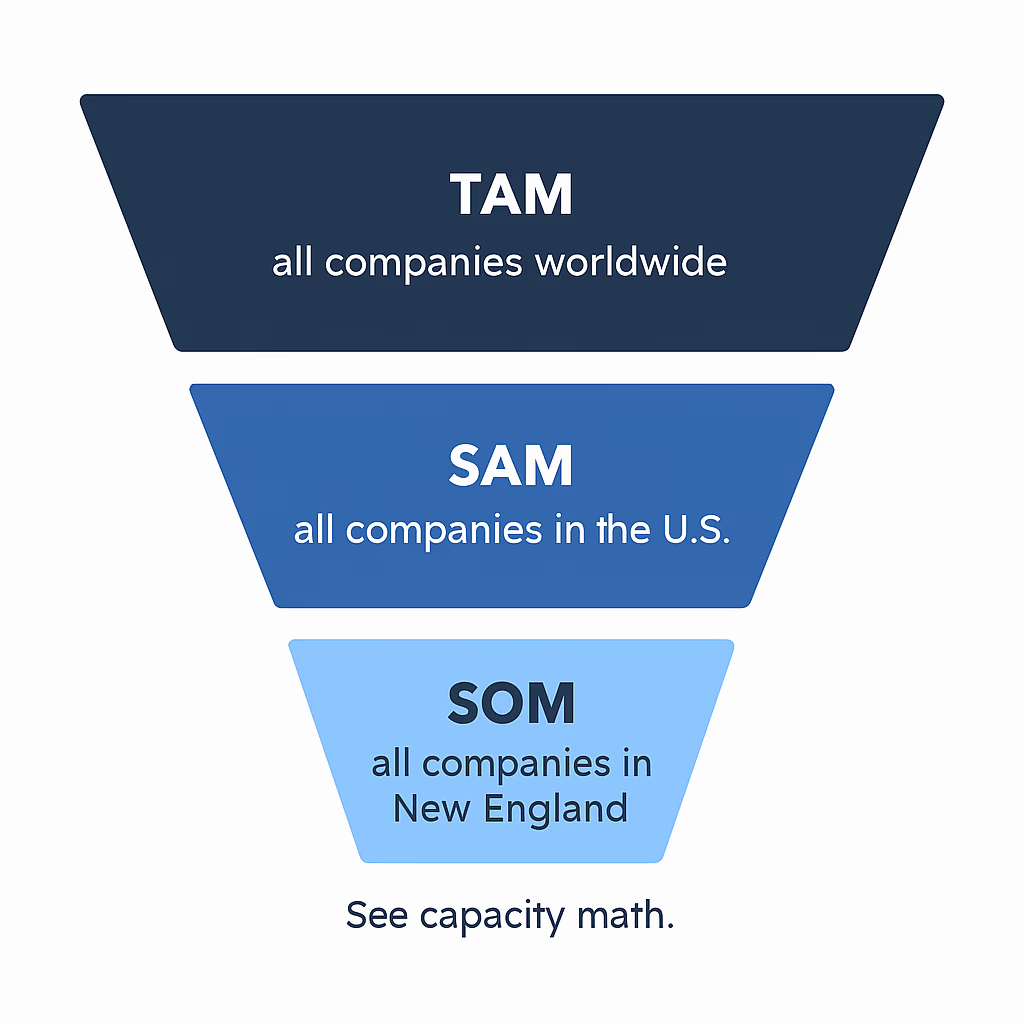
TAM (Total Addressable Market): The whole pie—total demand in your defined category.
SAM (Serviceable Available Market): The slice you can serve today given your product scope, ICP, geography, and compliance constraints.
SOM (Serviceable Obtainable Market): The realistic share you can win within a time horizon based on your GTM motion, competition, and current capacity.
Plain example:
TAM: Global helpdesk software.
SAM: EU SMB/mid‑market helpdesk tools with omnichannel support.
SOM (next 12–24 months): The subset you can credibly capture with your current outbound + partner motion.
Three Ways to Calculate TAM (with examples)
1) Top‑Down (industry reports) — when & how
What it is: Start with analyst or industry estimates for category size and then narrow to your SAM and SOM via filters (geo, vertical, company size, channels).
Pros: Fast to assemble; credible in mature, well‑defined categories with robust third‑party coverage.
Cons & pitfalls: The famous “we’ll take 1%” fallacy; category bloat (including segments you don’t serve); credibility gaps when your product addresses a niche subset.
How to do it well:
Choose reputable sources and match definitions (revenue vs units, time period, included sub‑categories).
Reconcile to your current product scope (cut out segments you don’t serve yet).
Convert to a SAM number you can defend; then map a SOM based on capacity (see below).
Mini‑example: Global helpdesk market = €15B. Your product serves EU SMB only, with limited channels → SAM after filters might be €2.1B. With your current coverage and win rates, SOM (next 2 years) might be €60–90M.
2) Bottom‑Up — the gold standard
What it is: Build the market from the ground up using accounts × adoption × seats/users × price (ACV). In SaaS, this is often the most defensible approach because it mirrors how you actually sell and bill.
Core formulas:
Revenue TAM:
#Accounts × Avg Seats per Account × Price per Seat × 12(or)#Customers × ACVSeat TAM (optional):
#Accounts × Avg Seats per AccountSOM (horizon‑based):
Revenue TAM × Expected Adoption Rate within time horizon
Why investors prefer it: It uses observable inputs—named accounts, real pricing, conversion assumptions—and exposes the levers (seat count, penetration) that drive growth.
Copy‑ready example:
Target accounts: 40,000
ACV: €2,400
Revenue TAM: 40,000 × €2,400 = €96,000,000
Upgrade the model:
Tier by segment (SMB, mid‑market, enterprise) with different ACVs, sales cycles, and win rates.
Sensitivity test seats (+/‑20%), price (+/‑10%), and adoption by segment.
3) Value Theory — willingness to pay
What it is: Estimate demand based on the value your solution creates and buyers’ willingness‑to‑pay (WTP). Useful when you’re creating/disrupting a category where historical data is scarce.
How to do it:
Run pricing research (surveys, conjoint, Van Westendorp, offer tests).
Quantify economic impact (time saved, risk reduced) and convert to a share‑of‑value price.
Triangulate with top‑down and bottom‑up to set a range rather than a single point estimate.
Use case: Replacing non‑consumption or manual processes where no direct “category revenue” exists yet.
Why TAM Matters Beyond the Pitch Deck
Product & PMF
TAM work forces segment clarity, validates that a real problem (with budget) exists, and helps prioritize features that unlock adoption. If your TAM is theoretical—e.g., undefined payer, unclear seat owner—you’ll build features for the wrong user or price point.
Sales Capacity & Territory Design
Think of TAM → SAM → SOM → Quotas as a conveyor belt. TAM tells you the full opportunity; SAM narrows to where you can sell now; SOM is what you can feasibly win in the next 1–3 years given headcount, motion, and win rates. From there you design territories and quotas:
Use SAM as your named‑account universe for territory carving.
Translate SOM into capacity: given AE quota and win rate, how many AEs and SDRs do you need?
Calibrate activity models (reply→meeting→SQL→win) to ensure your pipeline supports quota without over‑reliance on volume tactics.
Plays, Motions & Pipeline Hardening
Your TAM segments should guide plays and motions:
Plays: Persona‑specific value, competitor takeout, expansion/land‑and‑expand, compliance deadlines, or budget refresh cycles.
Motions: Outbound‑led, partner‑assisted, PLG‑assist, or event‑driven.
Outcome: A diversified pipeline portfolio across segments, improving forecast reliability and resilience when one segment slows.
Worked Example (SaaS)
Define ICP & Universe
ICP: EU mid‑market fintechs (50–500 employees) needing continuous compliance monitoring.
Universe build: Start with firmographics (fintech, 50–500, EU HQ), add intent/tech signals (regulated, specific core banking stack). Create a named list from data vendors + internal CRM. Remove duplicates and customers.
Bottom‑Up math (accounts × adoption × seats × price)
Inputs (example):
ICP accounts = 12,000
Adoption within 5‑year horizon = 25%
Avg seats/account = 40 (compliance + ops users)
Price/seat/month = €30 → ACV/seat = €360
Calculations:
Revenue TAM (100% adoption): 12,000 × 40 × €360 = €172.8M
SOM (5‑year adoption): 12,000 × 25% × 40 × €360 = €43.2M
Avg deal size: 40 seats × €360 = €14,400 ARR
Sensitivity check:
Seats ±20% → €13.8k–€17.3k ARR per deal.
Price ±10% → €12.96k–€15.84k ARR per deal.
Adoption 20–35% → SOM range €34.6M–€60.5M.
Translate to sales plan (headcount, activity model, quotas)
Assumptions:
AE quota = €480k ARR/year
Win rate (Opp→Closed Won) = 20%
Sales cycle = 90 days
SQL→Opp conversion = 60%; Meeting→SQL = 40%; Reply→Meeting = 8%
Back‑solve capacity:
AEs needed to land €6M new ARR (year 3 target): ≈ 12–14 AEs (allowing for ramp & attainment variance).
At €14.4k avg deal size and 20% win rate, each AE needs ~167 Opps/yr (33 wins) → 278 SQLs (at 60%), 695 Meetings (at 40%), 8,687 Replies (at 8%) across their territory.
With a 1:1 SDR:AE ratio, each SDR must generate ~580 Meetings/yr (or ~48/month) via blended channels; adjust with partner/PLG assist.
Table: Fill‑in worksheet (copy/paste into your planning doc)
Input | Value | Notes |
|---|---|---|
ICP Accounts | 12,000 | Named list, de‑duped |
Adoption (5‑yr) | 25% | For SOM |
Avg Seats/Acct | 40 | Role‑based seat model |
Price/Seat/Month | €30 | ACV/seat = €360 |
Revenue TAM | €172.8M | 100% adoption |
SOM (5‑yr) | €43.2M | Adoption × TAM |
Avg Deal Size | €14.4k | 40 × €360 |
AE Quota | €480k | ARR |
Win Rate | 20% | Opp→Won |
AEs Needed (Yr 3) | 12–14 | For €6M ARR |
SDR:AE Ratio | 1:1 | Adjust by motion |
What to do next: Use the SOM number to stage hiring (phased) and align territory capacity with pipeline goals. Re‑forecast quarterly as you learn true conversion and sales cycles.
Common TAM Mistakes (and fixes)
Inflated top‑down claims with no bottom‑up proof
Fix: Lead with ACV × account counts, show adoption scenarios (SOM), and keep the top‑down number as a sense‑check, not your headline.Mixing users with buyers; muddling segments and geos
Fix: Separate seat TAM from revenue TAM; model each segment (geo, size, industry) with its own assumptions and pricing tiers.Treating TAM as static
Fix: Refresh whenever you change pricing, product lines, go‑to‑market motion (e.g., partner‑led), or geography. Revisit at least annually so sales capacity and quotas stay aligned.Credibility gaps in investor conversations
Fix: Show your bottom‑up spreadsheet (assumptions, sources, sensitivity). Triangulate with value theory and reputable reports. Avoid “we’ll take 1% of a giant market.”
Conclusion
Looking to find companies in your TAM? Topo helps you uncover new, relevant prospects with intent‑signals monitoring—so you can turn a static TAM into prioritized account lists, targeted plays, and pipeline your team can actually close.